Why do wage book have child health certificates?
The Spinners' Wages Book
The Spinners' Wages Book records the weekly wages paid to between 30 and 60 named spinners and spinning families, at The John Foster and Son factory in Yorkshire, from August 1828 to January 1841. This particular collection, acquired for this profile, contains a wide range of information regarding child labour in England during the Industrial Revolution and is a valuable resource for further research.
As we can see from the one-page of the spinners’ wage book that includes the names of the spinners in the first left column and the total weekly income on the right, the three compartments represent the currency units of pound, shilling, and pence. In cases where factory wages are paid on a household basis, the brace symbol indicates that the child worker's wage is included within the household. Thus, we try to get a glimpse of child survival through their household income.
In addition, the front few pages of the Spinners’ Wage Book contain 28 health certificates for mill children (aged 11-17) with names and addresses, certified by a surgeon and signed by a magistrate. This stems from the enactment of the Factories Law of 1833, which made it compulsory for child laborer under the age of 13 to provide a health certificate to work.

Click on the white circles for more information
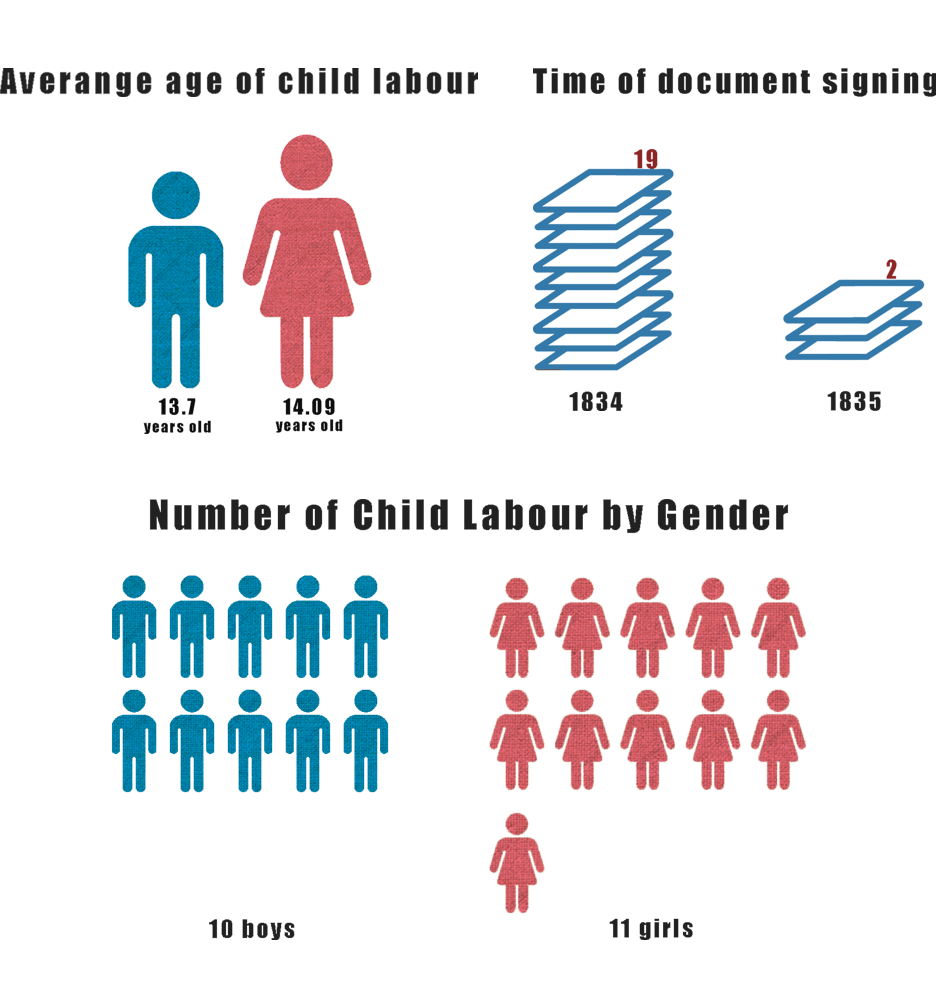
The information contained in child labourers' health certificates is thoroughly examined and compiled in order to comprehend the specific circumstances of child labourers. The statistic shows that all child labourers were older that 11 years old with the average age of girls being older at 14.09 years and the average age of males being younger at 13.7 years. This also matches what we have gathered from some literature: boys start working at a younger age than girls, with most boys being able to find work at the age of 8 or 9, while girls do not find jobs until the age of 12 (Cunningham, 1990). The number of girls and boys counted in the health certificate is 11 and 10 respectively, which is not a significant difference in numbers. As we can be seen from the timing of the issuance of the document, which is mainly concentrated in 1834, it can be proved that the enactment of the Factory Law legalized child labor.
press"2 people"or"3 people"or"4 people", get more details
In addition, in previous studies, we found that workers divided together by the symbol “Braces” were family members who have the same surname. So in measuring child labour, we chose families with that symbol in the book, divided into 2-person families, 3-person families, and 4-person families. 2-person households may contain child labour, 3 and 4-person households necessarily contain child labour. In terms of time we chose the period 1830 to 1836 as the range and counted the changes in the number of families of different sizes during this period to explore the changes in the number of child labourers before and after the 1833 law.
We discovered that the number of textile households declined significantly after 1833 by counting the number of households. It is our opinion that this is because of the Factory Act of 1833, which restricted the employment of children under the age of 9, resulting in a decrease in the number of 2-, 3-, and 4-person households. However, with the introduction of new factory machinery and the high demand for factory labour after 1835, the number of households rebounded, with a significant increase in 2-person households.
According to the above visualisation, the passage of the law limits the employment of child labour in the cotton and linen textile industries to a certain extent in terms of age, thereby reducing some child labour. However, as the industrial revolution's mechanisation deepened and labour demand increased, the number of child labour families began to rise again a few years after the law was passed.
It demonstrates a general irregular fluctuation in household wages around 1833, with no discernible upward or downward trend. As a result, we assume that the Factory Law had no significant effect on household wages.However, our wage statistics show a general irregular fluctuation in household wages around 1833, with no discernible upward or downward trend.
A graph was produced using pence as the unit of measurement to depict the average monthly wages of households of different sizes from 1830 to 1836. According to the variation in the lines, the average wage fluctuates in approximately the same manner for all households. However, the average wage for four-person households is generally higher than for the other two types of household.
In August 1833, the British Factories Act was passed, defining the working age and daily working hours for child laborers(Nardinelli, 1980). However, our wage statistics show a general irregular fluctuation in household wages around 1833, with no discernible upward or downward trend. As a result, we cannot be sure that the 1833 Factory Act affected the average household wages shown in the chart.
However, after 1834, some of the wage data for 3- and 4-person families is missing, indicating that the families did not keep continuous work records. It could also be due to work restrictions on child labour, which converted a family of 3 or 4 into 2-person family, resulting in a lack of data (the above statistics on the number of 2-person families also match this view to some extent).